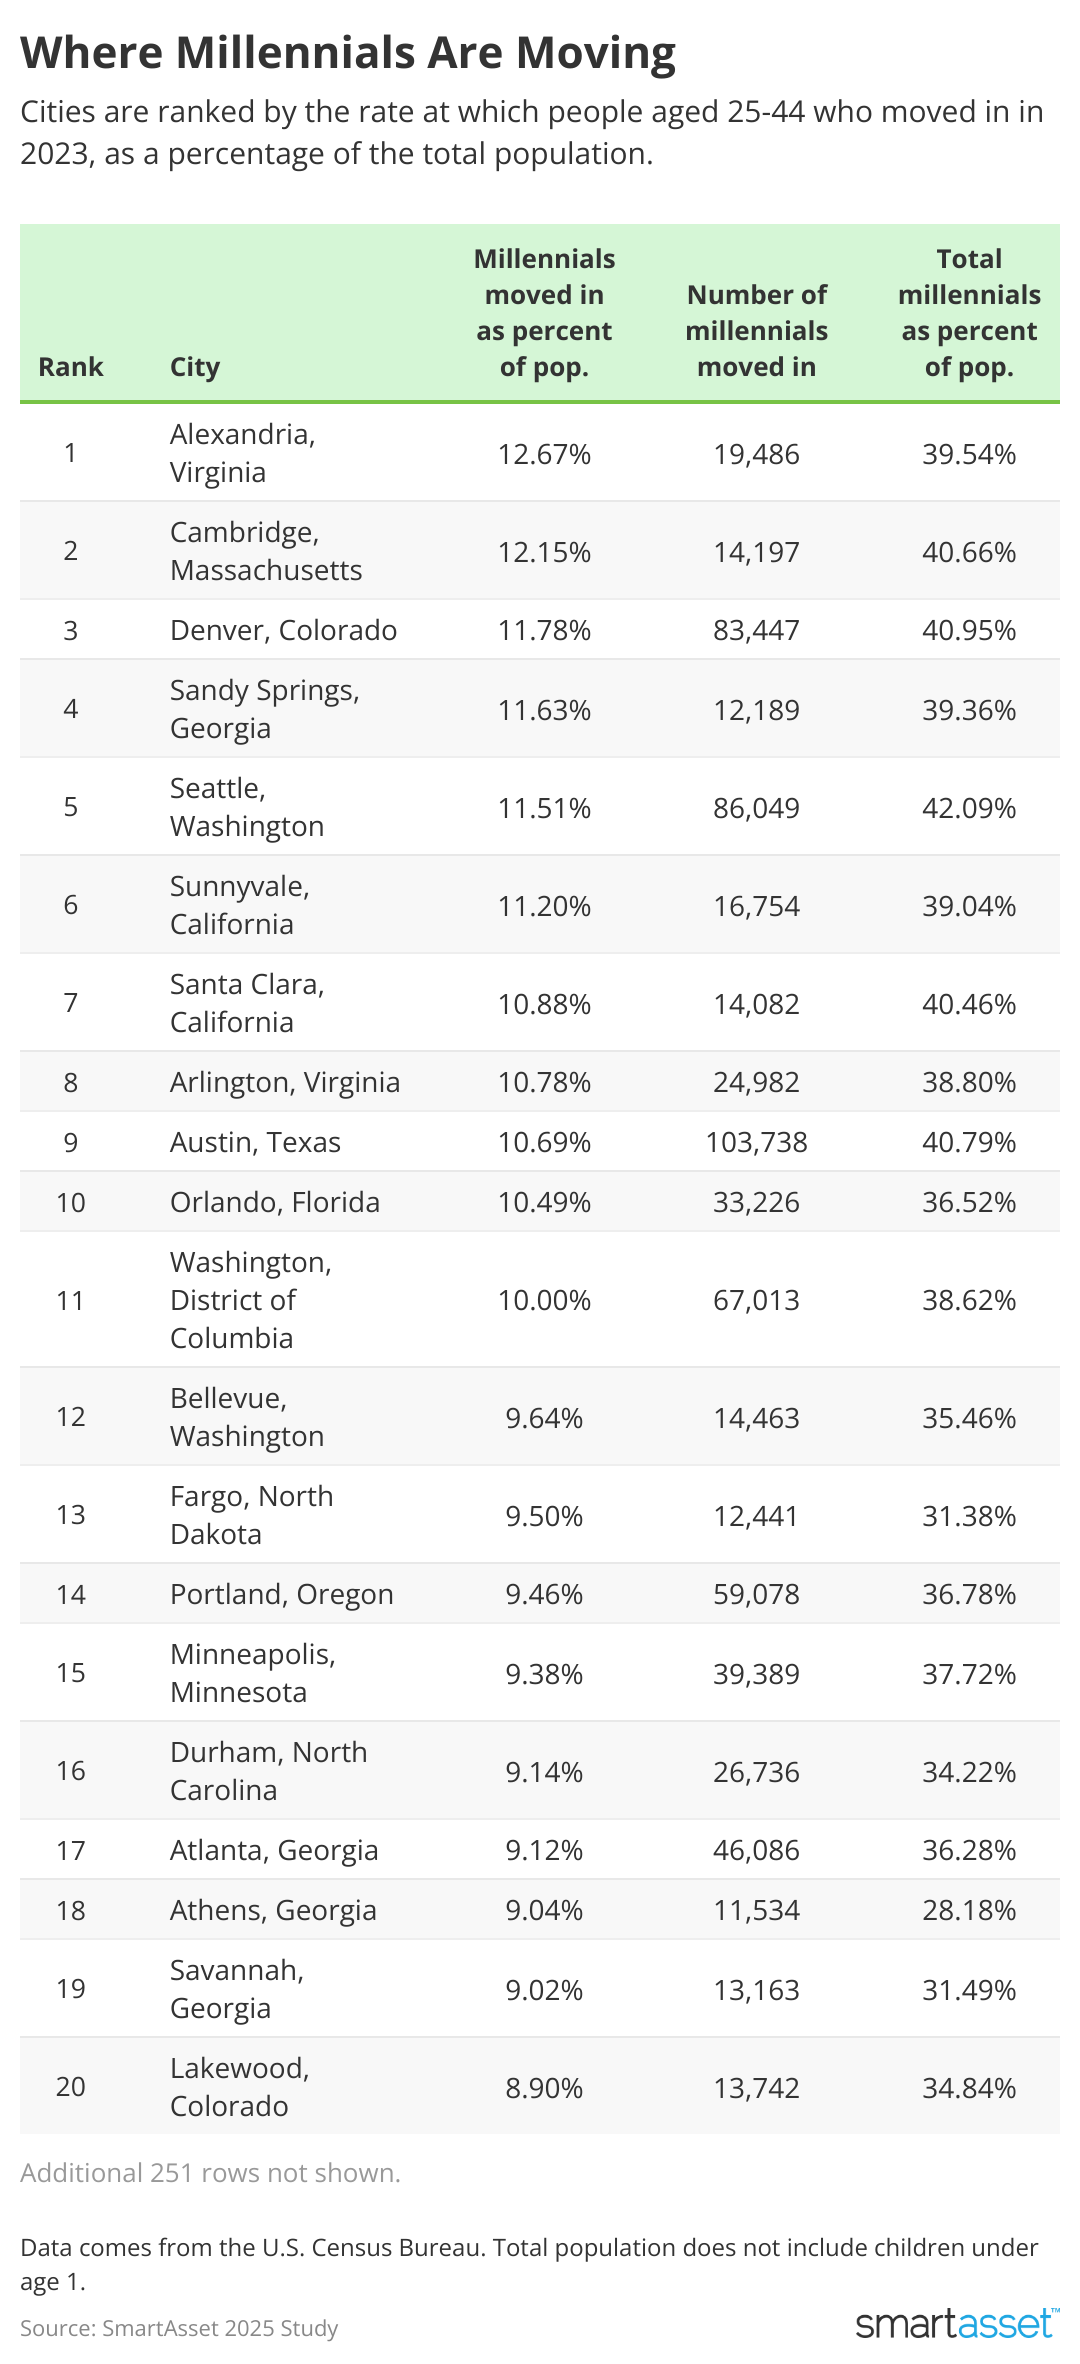
Steve Heap // Shutterstock In just one year, 5.49 million millennials moved to large U.S. cities. While about 73% of these transplants moved to a big city within their current state of residence, another 19% traversed states to start new–and nearly 8% came to these cities from abroad. Millennials are often in their prime earning years, and many have young families, which may significantly impact the communities they join and leave. With this in mind, SmartAsset ranked 271 of the largest U.S. cities based on the percentage of people between the ages of 25 and 44 who recently moved in. Key Findings In these two cities, millennials who have recently moved in make up over 12% of the population. Alexandria, Virginia, saw the highest influx of millennials relative to its population, with 12.67%–or 19,486– moving in during 2023, approximately 46% of whom came from out of state. Cambridge, Massachusetts, ranked second, with millennials making up 12.15% of new residents, or 14,197 people, 39% of whom relocated from outside the state. New York City had the most millennials move in by a factor of at least 2x. Not accounting for its population size, New York City had the most millennials join its perimeters at 362,649 move-ins in one year–accounting for 4.44% of the population. This number of move-ins was double that of Los Angeles, which had the second highest nominal move-ins at 187,210. These California cities were least attractive to millennials. While Sunnyvale and Santa Clara made the top 10 cities where millennials are moving to, more California cities rank at the bottom of the list. Jurupa Valley ranked last with 2.35% of its population comprising new millennial transplants. Other cities that were among the 10 least popular include Santa Ana (2.58%), Elk Grove (2.60%), San Bernardino (2.78%), Oxnard (2.78%), Ontario (2.96%), El Monte (3.08%), Garden Grove (3.11%) and Modesto (3.12%). Seattle has the largest segment of millennials relative to its population. Just over 42% of Seattle residents are between the ages of 25 and 44. Seattle also ranked fifth overall for most popular places for millennials to move to, with 11.51% of its population made up of millennials who moved in in 2023. Top 20 Cities Where Millennials Are Moving SmartAsset Alexandria, Virginia Percent of population represented by new millennial transplants: 12.67% Number of millennials moved in: 19,486 Total population (1 year and older): 153,790 Total number of millennials: 60,815 Millennials moved in from the same county: 4,680 Millennials moved in from a different county, same state: 5,795 Millennials moved in from a different state: 8,252 Millennials moved in from abroad: 760 Median household income: $110,294 Median monthly housing costs: $2,105 Millennials relative to the total population: 39.54% Cambridge, Massachusetts Percent of population represented by new millennial transplants: 12.15% Number of millennials moved in: 14,197 Total population (1 year and older): 116,843 Total number of millennials: 47,510 Millennials moved in from the same county: 4,933 Millennials moved in from a different county, same state: 3,741 Millennials moved in from a different state: 3,166 Millennials moved in from abroad: 2,356 Median household income: $134,307 Median monthly housing costs: $2,789 Millennials relative to the total population: 40.66% Denver, Colorado Percent of population represented by new millennial transplants: 11.78% Number of millennials moved in: 83,447 Total population (1 year and older): 708,432 Total number of millennials: 290,134 Millennials moved in from the same county: 33,816 Millennials moved in from a different county, same state: 25,735 Millennials moved in from a different state: 21,655 Millennials moved in from abroad: 2,241 Median household income: $94,157 Median monthly housing costs: $1,886 Millennials relative to the total population: 40.95% Sandy Springs, Georgia Percent of population represented by new millennial transplants: 11.63% Number of millennials moved in: 12,189 Total population (1 year and older): 104,836 Total number of millennials: 41,267 Millennials moved in from the same county: 5,909 Millennials moved in from a different county, same state: 3,813 Millennials moved in from a different state: 1,666 Millennials moved in from abroad: 800 Median household income: $110,401 Median monthly housing costs: $1,894 Millennials relative to the total population: 39.36% Seattle, Washington Percent of population represented by new millennial transplants: 11.51% Number of millennials moved in: 86,049 Total population (1 year and older): 747,884 Total number of millennials: 314,788 Millennials moved in from the same county: 51,638 Millennials moved in from a different county, same state: 5,166 Millennials moved in from a different state: 23,515 Millennials moved in from abroad: 5,731 Median household income: $120,608 Median monthly housing costs: $2,155 Millennials relative to the total population: 42.09% Sunnyvale, California Percent of population represented by new millennial transplants: 11.20% Number of millennials moved in: 16,754 Total population (1 year and older): 149,575 Total number of millennials: 58,401 Millennials moved in from the same county: 9,111 Millennials moved in from a different county, same state: 2,967 Millennials moved in from a different state: 2,515 Millennials moved in from abroad: 2,161 Median household income: $189,443 Median monthly housing costs: $3,012 Millennials relative to the total population: 39.04% Santa Clara, California Percent of population represented by new millennial transplants: 10.88% Number of millennials moved in: 14,082 Total population (1 year and older): 129,396 Total number of millennials: 52,349 Millennials moved in from the same county: 8,396 Millennials moved in from a different county, same state: 2,616 Millennials moved in from a different state: 2,185 Millennials moved in from abroad: 885 Median household income: $166,228 Median monthly housing costs: $2,941 Millennials relative to the total population: 40.46% Arlington, Virginia Percent of population represented by new millennial transplants: 10.78% Number of millennials moved in: 24,982 Total population (1 year and older): 231,669 Total number of millennials: 89,891 Millennials moved in from the same county: 7,395 Millennials moved in from a different county, same state: 5,233 Millennials moved in from a different state: 10,121 Millennials moved in from abroad: 2,234 Median household income: $140,219 Median monthly housing costs: $2,360 Millennials relative to the total population: 38.80% Austin, Texas Percent of population represented by new millennial transplants: 10.69% Number of millennials moved in: 103,738 Total population (1 year and older): 970,338 Total number of millennials: 395,776 Millennials moved in from the same county: 55,591 Millennials moved in from a different county, same state: 21,403 Millennials moved in from a different state: 19,890 Millennials moved in from abroad: 6,854 Median household income: $91,501 Median monthly housing costs: $1,828 Millennials relative to the total population: 40.79% Orlando, Florida Percent of population represented by new millennial transplants: 10.49% Number of millennials moved in: 33,226 Total population (1 year and older): 316,702 Total number of millennials: 115,668 Millennials moved in from the same county: 17,216 Millennials moved in from a different county, same state: 8,210 Millennials moved in from a different state: 4,847 Millennials moved in from abroad: 2,953 Median household income: $69,414 Median monthly housing costs: $1,762 Millennials relative to the total population: 36.52% Washington, District of Columbia Percent of population represented by new millennial transplants: 10% Number of millennials moved in: 67,013 Total population (1 year and older): 670,127 Total number of millennials: 258,814 Millennials moved in from the same county: 36,390 Millennials moved in from a different county, same state: 0 Millennials moved in from a different state: 24,465 Millennials moved in from abroad: 6,159 Median household income: $108,210 Median monthly housing costs: $2,083 Millennials relative to the total population: 38.62% Bellevue, Washington Percent of population represented by new millennial transplants: 9.64% Number of millennials moved in: 14,463 Total population (1 year and older): 149,955 Total number of millennials: 53,175 Millennials moved in from the same county: 7,414 Millennials moved in from a different county, same state: 749 Millennials moved in from a different state: 3,197 Millennials moved in from abroad: 3,103 Median household income: $158,253 Median monthly housing costs: $2,551 Millennials relative to the total population: 35.46% Fargo, North Dakota Percent of population represented by new millennial transplants: 9.50% Number of millennials moved in: 12,441 Total population (1 year and older): 130,895 Total number of millennials: 41,073 Millennials moved in from the same county: 8,193 Millennials moved in from a different county, same state: 685 Millennials moved in from a different state: 2,654 Millennials moved in from abroad: 909 Median household income: $61,422 Median monthly housing costs: $1,038 Millennials relative to the total population: 31.38% Portland, Oregon Percent of population represented by new millennial transplants: 9.46% Number of millennials moved in: 59,078 Total population (1 year and older): 624,727 Total number of millennials: 229,791 Millennials moved in from the same county: 32,810 Millennials moved in from a different county, same state: 10,372 Millennials moved in from a different state: 13,704 Millennials moved in from abroad: 2,192 Median household income: $86,057 Median monthly housing costs: $1,746 Millennials relative to the total population: 36.78% Minneapolis, Minnesota Percent of population represented by new millennial transplants: 9.38% Number of millennials moved in: 39,389 Total population (1 year and older): 419,780 Total number of millennials: 158,333 Millennials moved in from the same county: 20,511 Millennials moved in from a different county, same state: 7,673 Millennials moved in from a different state: 9,757 Millennials moved in from abroad: 1,448 Median household income: $81,001 Median monthly housing costs: $1,506 Millennials relative to the total population: 37.72% Durham, North Carolina Percent of population represented by new millennial transplants: 9.14% Number of millennials moved in: 26,736 Total population (1 year and older): 292,429 Total number of millennials: 100,080 Millennials moved in from the same county: 11,099 Millennials moved in from a different county, same state: 6,781 Millennials moved in from a different state: 7,055 Millennials moved in from abroad: 1,801 Median household income: $80,064 Median monthly housing costs: $1,567 Millennials relative to the total population: 34.22% Atlanta, Georgia Percent of population represented by new millennial transplants: 9.12% Number of millennials moved in: 46,086 Total population (1 year and older): 505,496 Total number of millennials: 183,397 Millennials moved in from the same county: 21,683 Millennials moved in from a different county, same state: 12,776 Millennials moved in from a different state: 9,848 Millennials moved in from abroad: 1,779 Median household income: $85,880 Median monthly housing costs: $1,812 Millennials relative to the total population: 36.28% Athens, Georgia Percent of population represented by new millennial transplants: 9.04% Number of millennials moved in: 11,534 Total population (1 year and older): 127,615 Total number of millennials: 35,962 Millennials moved in from the same county: 5,953 Millennials moved in from a different county, same state: 1,786 Millennials moved in from a different state: 2,918 Millennials moved in from abroad: 877 Median household income: $53,775 Median monthly housing costs: $1,242 Millennials relative to the total population: 28.18% Savannah, Georgia Percent of population represented by new millennial transplants: 9.02% Number of millennials moved in: 13,163 Total population (1 year and older): 145,911 Total number of millennials: 45,947 Millennials moved in from the same county: 6,310 Millennials moved in from a different county, same state: 3,240 Millennials moved in from a different state: 3,170 Millennials moved in from abroad: 444 Median household income: $56,823 Median monthly housing costs: $1,355 Millennials relative to the total population: 31.49% Lakewood, Colorado Percent of population represented by new millennial transplants: 8.90% Number of millennials moved in: 13,742 Total population (1 year and older): 154,379 Total number of millennials: 53,793 Millennials moved in from the same county: 3,522 Millennials moved in from a different county, same state: 6,727 Millennials moved in from a different state: 2,699 Millennials moved in from abroad: 794 Median household income: $83,987 Median monthly housing costs: $1,755 Millennials relative to the total population: 34.84% Data and Methodology Data comes from the Census Bureau 1-Year American Community Survey for 2023. This SmartAsset study included 271 cities that had available data and 100,000 or more people aged 1 or over. Millennials were defined as those aged 25 to 44. Cities were ranked by the percentage of the total population represented by millennials who moved into the city in 2023. This story was produced by SmartAsset and reviewed and distributed by Stacker.
Cities attracting the most millennials
Feb 20, 2025 | 9:30 AM


